NGINX Performance Metrics with Prometheus
Prometheus is a combination of monitoring tool and time-series database that I have come to appreciate highly over the last few months. This article demonstrates how Prometheus can be used to visualize and monitor various web server metrics without changing the configuration of the web server itself.
Metrics are imported into Prometheus by pulling. This means that a monitored
service needs to offer an HTTP endpoint which will be queried by Prometheus in
regular intervals (usually 15 seconds). This endpoint (for example,
http://<service-name>/metrics) needs to serve a response with the respective
time series data:
http_response_count_total{application="my-application"} 12423
http_response_time_seconds{application="my-application"} 1832745
This works really well in Microservice Architectures – here, every service can
implements its own /metrics endpoint that produces each and every conceivable
metrics.
The Problem
This approach does not work that well when you want to use Prometheus to monitor performance metrics of (older) web applications served by a traditional LEMP stack (Linux, NGINX, MySQL, PHP). The reason for this is that a PHP application typically does not track metrics like the amount of processed requests or the average request time (or would need to gather this data by itself and then persist it in a database).
There are multiple connectors available for integrating NGINX web servers with
Prometheus – however, many of those just process the information available on
the NGINX status page offered by the ngx_http_stub_status_module module (not
enough detail for my use case), or require you to reconfigure the web server to
send its data to another logging server (much too invasive for my cherished
legacy application).
My Solution
My solution to this challenge is my own Exporter that can generate performance
metrics from existing NGINX access logs. This exporter is available as
Open Source on Github, and exports various metrics based on an
existing access.log file:
- Number of processed requests per HTTP request method and response status
- The total sum of time needed for processing HTTP requests per HTTP request method and status (together with the first metrics, this can be used to compute the average response time)
- The total sum of the “Upstream Time”, which is the time that NGINX spent on waiting for PHP-FPM or other FastCGI modules.
- Various quantiles of the response times and upstream times
Configuration
The NGINX exporter is configured using an HCL config file. In this config file, you can configure multiple “namespaces” – there will then be exported as separate sets of metrics. Have a look at the following configuration file as an example:
1
2
3
4
5
6
7
8
9
10
11
12
13
14
listen {
  port = 4040
  address = "0.0.0.0"
}

namespace "app1" {
  format = "$remote_addr - $remote_user [$time_local] \"$request\" $status $body_bytes_sent \"$http_referer\" \"$http_user_agent\" \"$http_x_forwarded_for\""
  source_files = ["/var/log/nginx/access.log"]
  labels {
    app = "my-application"
    environment = "production"
    foo = "bar"
  }
}
The exporter starts its own HTTP server that listens on the configured IP
address and port (by default, 0.0.0.0:4040). Using the URL
http://<IP>:4040/metrics, Prometheus can then scape the respective performance
metrics.
The namespace name (app1, in this case) will later be used in the name of the
exported metrics – for example, app1_http_response_time_seconds. The format
(format) describes the format in which NGINX writes its access logs (for more
information, refer to the documentation).
Starting the Exporter
The exporter is a statically compiled Go binary, that you can install immediately after downloading:
wget https://github.com/martin-helmich/prometheus-nginxlog-exporter/releases/download/v1.0.0/prometheus-nginxlog-exporter
./prometheus-nginxlog-exporter -config-file /pfad/zur/config.hcl
To ensure that the exporter starts automatically on system startup, you can
configure a systemd unit (starting at Debian 8, Ubuntu 16.04 or CentOS 7).
Place this file at /etc/systemd/system/prometheus-nginxlog-exporter.service:
1
2
3
4
5
6
7
8
9
10
11
12
[Unit]
Description=NGINX metrics exporter for Prometheus
After=network-online.target

[Service]
ExecStart=/usr/local/bin/prometheus-nginxlog-exporter -config-file /etc/prometheus-nginxlog-exporter.hcl
Restart=always
ProtectSystem=full
CapabilityBoundingSet=

[Install]
WantedBy=multi-user.target
Note that this unit file expects the executable to be located at
/usr/local/bin/prometheus-nginxlog-exporter and the configuration file to be
located at /etc/prometheus-nginxlog-exporter.hcl. Of course, you can adjust
these paths as required.
The Result
I have been operating the prometheus-nginxlog-exporter in production for some
time,now. Especially together with Grafana, you can easily create
some excellent reports and monitoring dashboards:
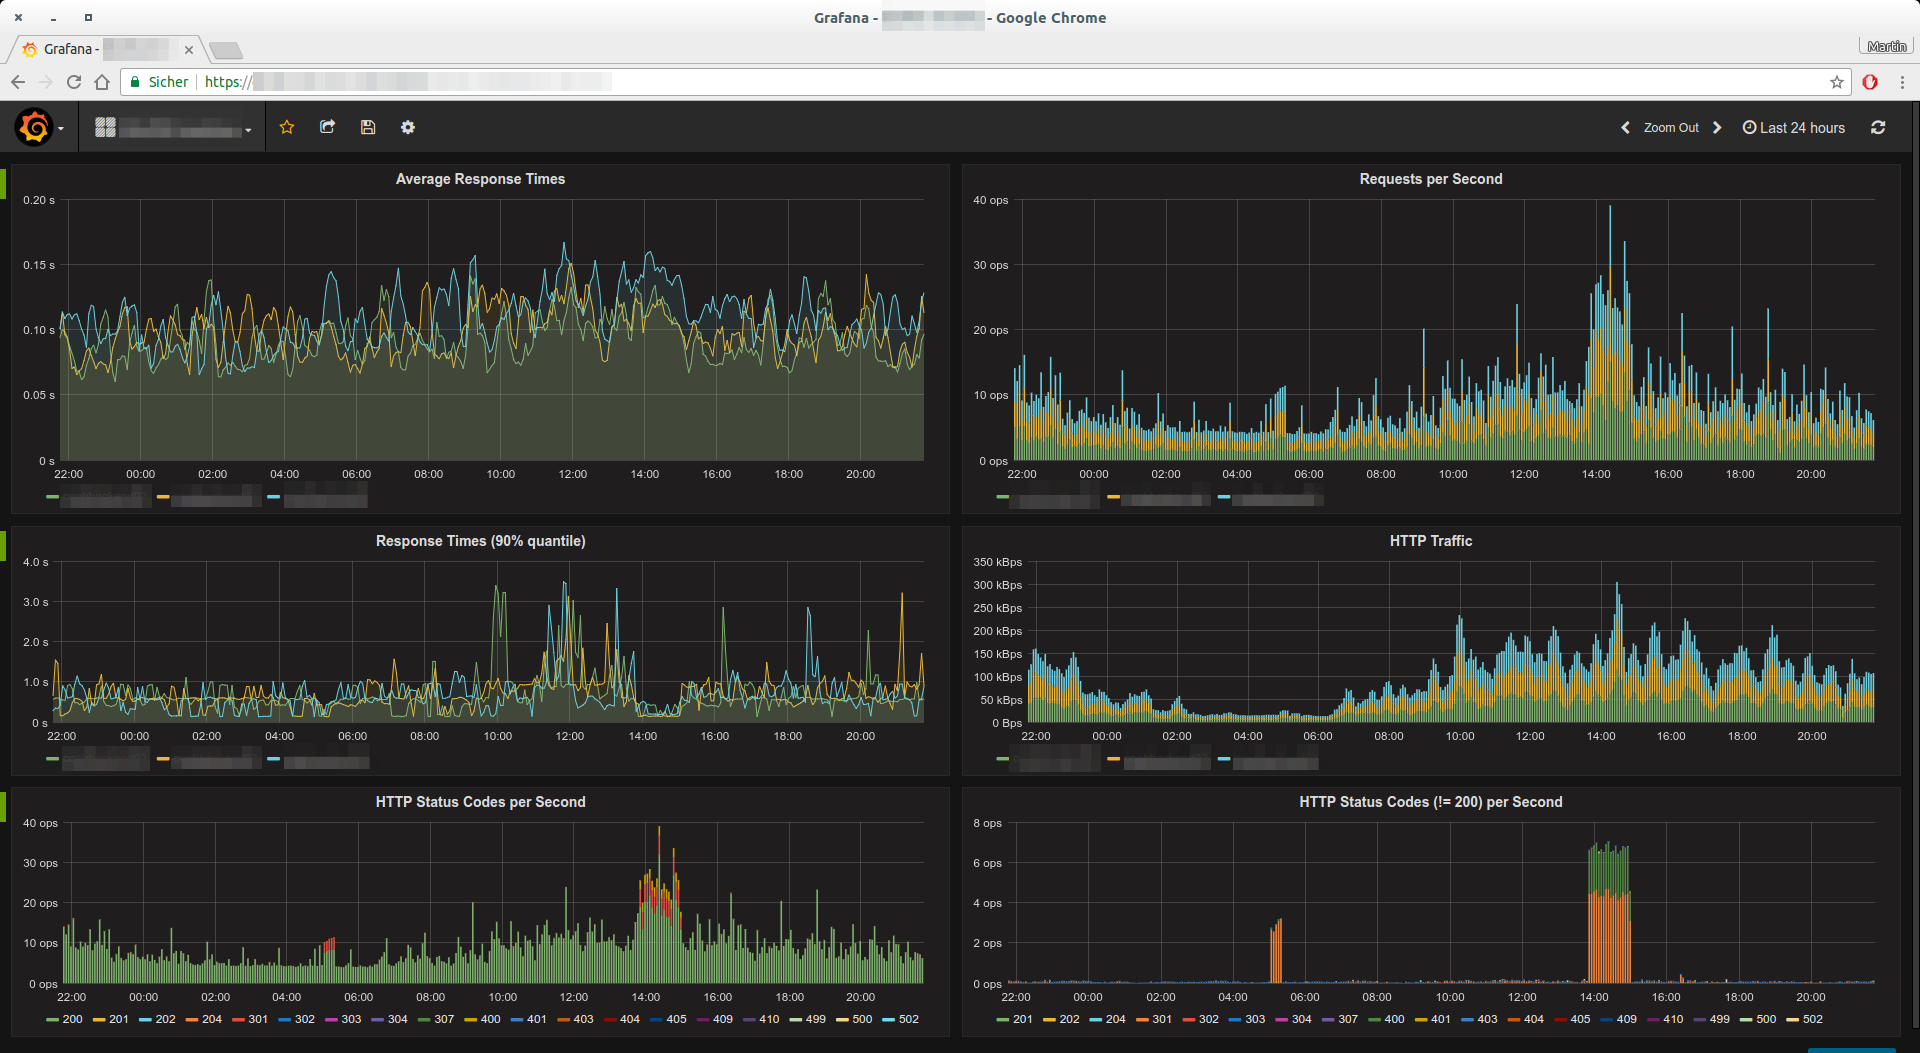
The diagrams in the screenshot above were generated from the following Prometheus queries:
- Average response time:
sum(rate(app_http_response_time_seconds_sum[5m])) by (instance) / sum(rate(app_http_response_time_seconds_count[5m])) by (instance) - Requests per second:
sum(rate(app_http_response_time_seconds_count[1m])) by (instance) - Response time (90% quantile):
app_http_response_time_seconds{quantile="0.9",method="GET",status="200"} - HTTP traffic:
sum(rate(app_http_response_size_bytes[5m])) by (instance) - Status codes per second:
sum(rate(app_http_response_count_total[1m])) by (status)